Owner Occupied Housing in Oregon [2010]
In this map, I choose to focus on the intersection of social demography and GIS. I ask the question, “What is the relationship between homeownership and race in Oregon”?
I extracted data from the 2010 US Census, provided by the US Census Bureau. Within the 2010 census data, I chose to look at the total population of the five major race demographics provided, including: White only population, Black or African American population, Asian population, American Native or Alaska Native population, and Hispanic or Latino population. I used 2010 census data for the total number of homes occupied by their owner within census tract boundaries. I also took data from the Oregon Spatial Data Library to provide boundaries and city labels to my final maps.
I used many tools to alter my data to best fit my spatial question. I edited my data in Excel and ArcGIS to remove excessive data that I wasn’t using and worked within the attribute table fields section to make my data more understandable and accessible. Since I took data from many sources, I used the Project tool to conform my layers to an Oregon based projection system (NAD 1983 (2011) Oregon Statewide Lambert Ft (Int.). I used the Select by Attributes function to single out Oregon only data and then used Spatial Join to connect and limit my desired census data to the Oregon region. Finally, when finishing my maps, I used labeling and edits to symbology to make my maps as representative of the data and as polished as possible.

Map 1 - White population in Oregon as it relates to homeownership, shows that homeownership in white-dominated areas of Oregon is very high. I think this correlation is due to the fact that the total white population is high and well distributed throughout Oregon, so there are more opportunities for homeownership for the white population.

Map 2 - The second largest demographic in Oregon is the Hispanic and Latino population. While the Hispanic and Latino population is not as plentiful as the White population, it is also well spread out and has larger concentrations of people in high ownership areas than some of the other demographics.

Map 3 - The Asian population in Oregon falls directly in the middle of our five demographics. In terms of homeownership, the Asian population is very mixed. It seems as though there is more grouping based on areas of high Asian population, than based on homeownership. The areas of highest Asian population, especially in Hillsboro, Beaverton, South East Portland, and East Portland have a mixed value of homeownership and I do not see a strong correlation between homeownership and population distribution.
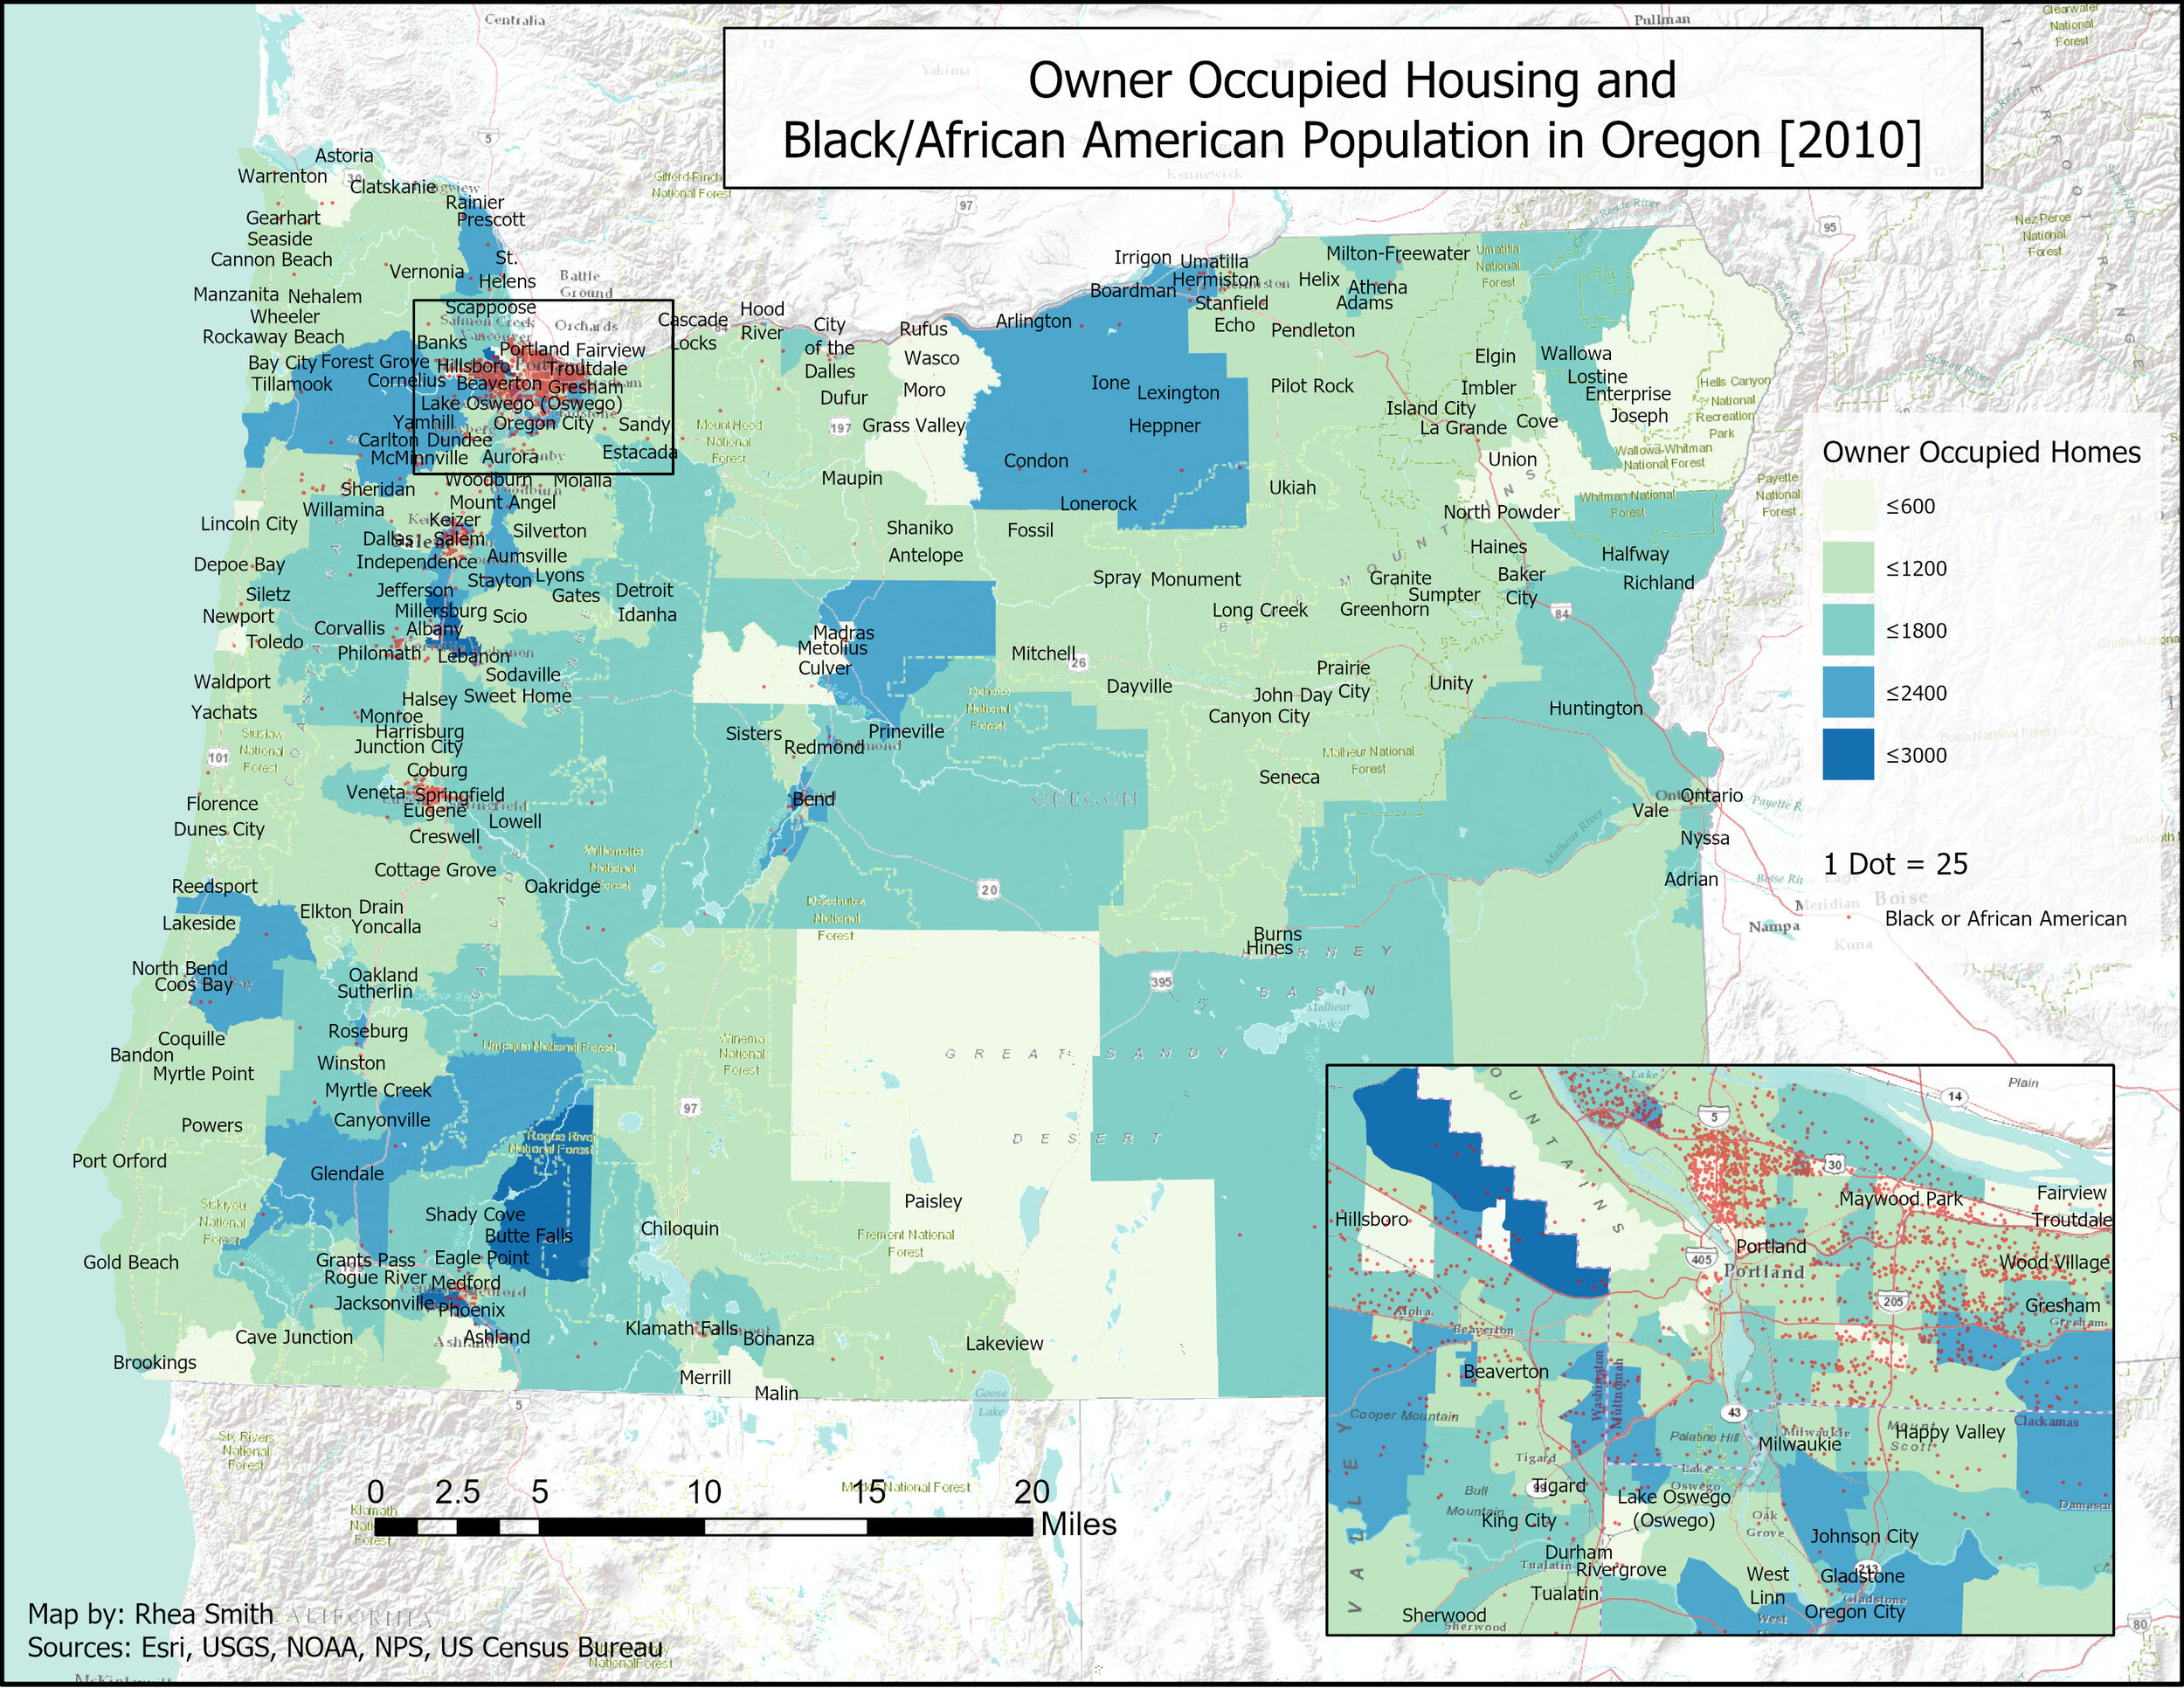
Map 4 - The Black and African American population is much less distributed than other demographics represented in my maps. There is more population clustering and fewer areas where the Black and African American population is plentiful. In Portland, most of the Black and African American population lives in North Portland and North East Portland, where we see medium to low values of homeownership.

Map 5 - The American Indian and Alaska Native population in Oregon is quite low. While the Black and African American population is also quite low, the American Indian and Alaska Native population is far more spread out across the state. Portland has the highest concentration of American Indian and Alaska Native peoples with a very even distribution throughout the city. Generally speaking, there are fewer hotspots of this population in high homeownership areas, but the data does not support a correlation between homeownership and this population’s concentration in any one area.